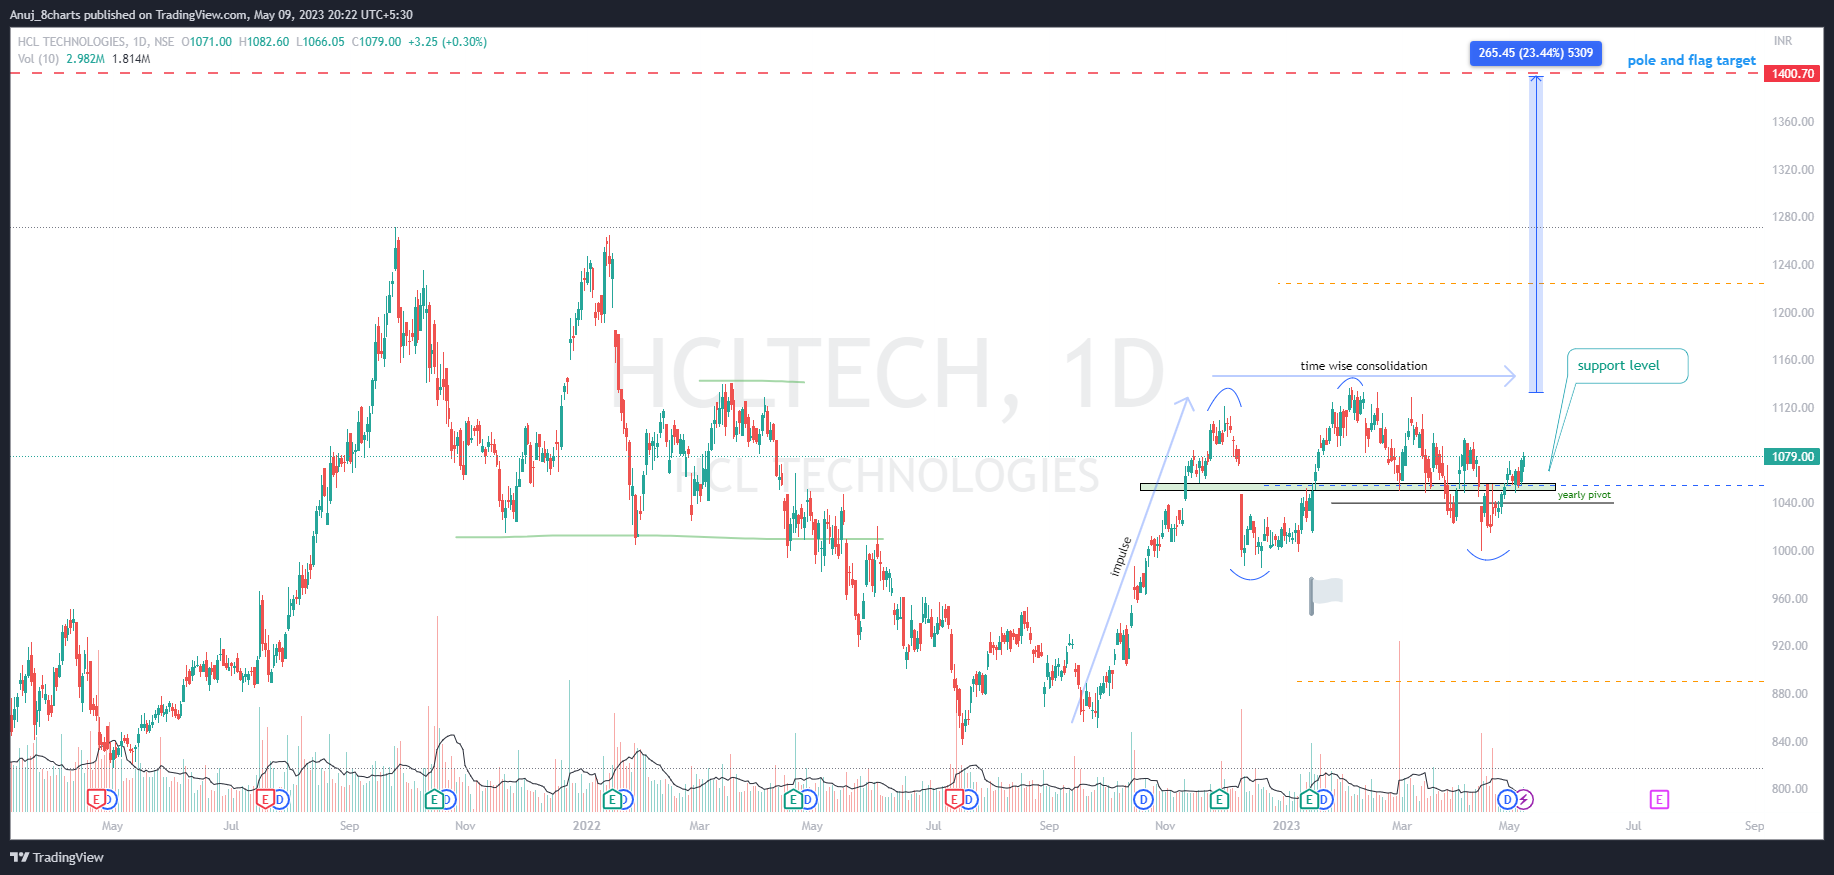
HCL TECHNOLOGIES BULLISH FLAG
HCLTECH 1D chart :
◼ a bullish flag is appearing on the charts, also a recent support level has been tested ( zoom image)
◼ impulse and time wise consolidation is visible ( which forms a bullish flag like structure )
higher lows and higher highs are also evidential for up-trend.
◼ by the time we have the upper range breached , until then we can have multiple short term trades ( will post short term trades for the same , but keeping in mind the bullish view on higher timeframe )
◼ also the prices are higher than the Yearly pivot level
bullish flag target 1400 points
yearly positional / investment view
www.twitter.com/anujology